
Biodiversity Crisis
Advanced · 18 min read
By Express.Love Science Team|16 peer-reviewed sources||Fact-checked: March 2026|Our Editorial Process
Evidence-based science journalism. Every claim verified against peer-reviewed research.
🦋
1M
Evidence-based science journalism. Every claim verified against peer-reviewed research.
1M
© 2026 Express Love Inc. — All Rights Reserved. Original research-backed content. Unauthorized reproduction, derivative audio/video adaptations, or use for AI training is strictly prohibited without written consent.
species at risk of extinction
68%
wildlife decline since 1970
100-1,000x
current extinction rate
We are living through Earth's sixth mass extinction — the first caused by a single species. 1 million species face elimination within decades. Insects are vanishing 8x faster than vertebrates. The biological networks we depend on for food, medicine, clean air, and a stable climate are unravelling in real time, faster than scientists predicted.
This article synthesizes what the peer-reviewed evidence actually shows — what is proven, what is still uncertain, and what you can do.
19 sources16 peer-reviewed papers + 3 scientific background sources. Uncertainty stated clearly.
Species disappear from Earth every day. The rate at which they do so, and the ecological and economic price attached to each loss, is one of the most consequential questions in contemporary science. Understanding the biodiversity crisis requires looking across multiple scales — from individual arthropods on a coffee farm in Puerto Rico to the vast peat swamp forests of Borneo, from flying insect populations in German nature reserves to the coral systems of the Great Barrier Reef. The evidence, assembled across thousands of studies over five decades, points in one direction: we are living through a mass extinction, the first caused by a single species.
The term mass extinction has a precise scientific meaning. Geologists use it to describe periods when more than 75% of Earth's species disappeared within a geologically short interval — roughly two million years or fewer. Five such events are documented in the fossil record: the Ordovician-Silurian (440 million years ago), the Late Devonian (375 million years ago), the Permian-Triassic (252 million years ago, when 96% of species vanished), the Triassic-Jurassic (201 million years ago), and the Cretaceous-Paleogene (66 million years ago), when an asteroid impact eliminated non-avian dinosaurs and 76% of all species.
The sixth mass extinction is the current period of accelerated species loss driven by human activity — habitat destruction, climate change, pollution, overexploitation, and invasive species. Unlike the previous five, which were caused by geological or cosmic forces over millions of years, this one is unfolding across decades. Scientists estimate that 1 million species face extinction within decades if current trends continue (Díaz et al., 2019).
Quantifying it requires comparing modern extinction rates to the background rate — the natural pace at which species disappear with no human influence. Paleontologists estimate the background at roughly 0.1 to 2 extinctions per million species-years. Barnosky et al. (2011) found vertebrate species are being lost at 100 times this baseline. Ceballos et al. (2017) extended the analysis, documenting what they called biological annihilation — not merely species extinction but the collapse of wildlife populations within species that still technically survive. Among 177 mammal species examined, all lost at least 30% of their range between 1900 and 2015; 40% lost more than 80%.
The distinction between species extinction and population collapse matters. A species reduced from millions to thousands loses its ecological function — its role in seed dispersal, predation, pollination — long before it is officially declared extinct. Measuring only formal extinctions drastically underestimates the scale of what is happening (Ceballos et al., 2017).
Scientists estimate between 150 and 200 species go extinct every 24 hours — but precise counting is impossible because most of Earth's estimated 8.7 million species have never been formally described.
The figures derive from extrapolating observed extinction rates in well-documented groups (birds, mammals) across the total estimated species count. Pimm et al. (2014) analyzed IUCN Red List data and found modern rates 100 to 10,000 times above background depending on the taxon and region. The IUCN has assessed roughly 150,000 species; of those, more than 42,000 are currently threatened.
Extinction debt compounds the uncertainty further. Species do not vanish immediately when their habitat is destroyed — populations persist in remnant fragments for decades before final extinction. Stork (2009) estimated that the extinctions caused by current levels of deforestation will play out over the next 50 to 100 years, meaning the visible rate today significantly understates what has already been committed. The species we have displaced are still dying. We simply have not finished counting them.
Different taxonomic groups face the crisis at different rates and for different reasons.
| Group | Estimated Species | % Threatened | Primary Driver |
|---|---|---|---|
| Amphibians | ~8,000 | >40% | Chytrid fungus, habitat loss |
| Sharks and rays | ~1,100 | ~37% | Overfishing, bycatch |
| Freshwater fish | ~18,000 | ~33% | Dams, pollution, extraction |
| Reptiles | ~10,000 | ~21% | Habitat loss, wildlife trade |
| Mammals | ~5,500 | >26% | Hunting, habitat fragmentation |
| Coral species | ~800 | ~33% | Ocean warming, acidification |
| Plants | ~350,000 | ~21% | Deforestation, land conversion |
| Birds | ~10,000 | ~12% | Land use change, invasive species |
| Insects | ~5.5M (est.) | ~40% declining | Pesticides, habitat loss |
Amphibians are the most threatened vertebrate class. Batrachochytrium dendrobatidis (Bd), a fungal pathogen, has caused the decline or extinction of at least 500 species across 60 countries — the most devastating wildlife disease ever recorded. Their permeable skin, sensitivity to moisture, and biphasic life cycles make them early indicators of ecosystem stress; amphibian health tracks ecosystem health with unusual precision.
Insects face a crisis whose scale was only recently quantified. Hallmann et al. (2017) measured total flying insect biomass across 63 German nature reserves over 27 years and found a 76% seasonal decline — even within designated protected areas. Wagner et al. (2021) synthesized global evidence and concluded approximately 40% of insect species are declining, with total biomass falling roughly 2.5% per year. The consequences extend far beyond insects: they perform pollination valued at $577 billion annually in crop production, biological pest control, nutrient cycling, and form the foundational prey base for birds, bats, freshwater fish, and amphibians.
Birds offer the clearest statistical picture because they are among the most monitored groups on Earth. Rosenberg et al. (2019) analyzed 529 North American bird species across all habitats and found the continent had lost approximately 3 billion birds since 1970 — a 29% decline in total abundance. Grassland birds lost 53% of their populations. The losses cut across common as well as rare species, indicating systemic ecosystem disruption rather than targeted decline in already-vulnerable taxa.
The five primary drivers of biodiversity loss are: (1) land and sea use change — habitat destruction through agriculture, urban expansion, and logging; (2) direct exploitation — hunting, fishing, and wildlife trade; (3) climate change — warming temperatures disrupting species ranges and phenology; (4) pollution — pesticides, plastics, and nutrient runoff; and (5) invasive alien species spreading disease and outcompeting natives. All five are driven by human activity (Díaz et al., 2019).
Habitat destruction is the dominant driver. Newbold et al. (2016) mapped global biodiversity intactness and found that 58% of Earth's land surface — home to 71% of the global human population — had already crossed the safe planetary boundary for biodiversity. The IPBES Global Assessment (2019) reported that 75% of Earth's ice-free land surface has been significantly altered, and more than 85% of global wetland area has been lost since 1700. Agricultural expansion accounts for the majority of this transformation: food production now occupies roughly 50% of habitable land.
Direct exploitation remains the leading driver of marine biodiversity decline. Global fisheries extract approximately 80 million tonnes of wild fish per year; the FAO estimates 35% of commercial fish stocks are overexploited. Among sharks and rays, 37% of species are threatened — the highest rate among marine vertebrate groups — primarily from targeted fishing and bycatch. On land, illegal wildlife trade is the world's fourth-largest criminal enterprise, directly targeting mammals, birds, and reptiles that cannot sustain commercial harvest.
Climate change currently accounts for roughly 20% of biodiversity threat and is projected to become the primary driver by mid-century. Species ranges are shifting toward higher latitudes at an average of 17 kilometers per decade and to higher elevations at 11 meters per decade. Many species cannot disperse fast enough or encounter unsuitable habitat before reaching climate-appropriate conditions. Phenological mismatches — flowers blooming before pollinators emerge, migratory prey arriving before predators have reproduced — compound direct thermal stress.
Arthropods — insects, spiders, mites, and their relatives — make up the majority of animal species on Earth and perform functions across nearly every terrestrial ecosystem. They are also among the first casualties when agricultural intensification replaces diverse native vegetation. In Puerto Rico, the transformation of tropical forest into conventional coffee plantations produced documented reductions in arthropod diversity, with shade-grown systems retaining significantly higher species richness than sun-grown monocultures (Perfecto, 1997).
This matters because arthropod decline is not merely a species-count problem. It signals dysfunction in ecosystem processes. Pollinators disappear. Decomposers thin out. Predators that would otherwise control herbivore populations are lost. The simplified arthropod assemblages found in intensively managed agro-ecosystems are less functionally redundant — meaning fewer species can perform the same ecological role, and there is less insurance against further disruption (Perfecto, 1997).
Agricultural transformation represents one of the clearest, most measurable pathways through which humans reduce biodiversity at landscape scale. The arthropod losses documented in Puerto Rico are not anomalies; they represent a pattern that repeats wherever high-diversity habitat is replaced with simplified, managed land cover.
The headline numbers associated with modern extinction rates — figures suggesting species are disappearing thousands of times faster than background geological rates — have generated scientific debate alongside public concern. Stork (2009) examined these estimates critically, questioning methodological assumptions underpinning species-area relationship models historically used to project extinction rates from habitat loss data.
The core issue is that species-area relationships can overestimate local extinctions because species do not vanish immediately when habitat is reduced — they may persist in remnant patches or degraded landscapes for extended periods before final extinction. This creates an extinction debt: species committed to eventual extinction but not yet counted as lost (Stork, 2009).
This does not mean extinction rates are lower than feared. It means the accounting is complex. Stork (2009) found that while some projections may have been inflated, the overall trajectory of biodiversity loss under continued habitat destruction remains serious. Measurement uncertainty should prompt methodological refinement, not complacency. The extinction debt framing suggests that even if visible extinctions appear modest today, the consequences of current habitat loss will manifest across the coming decades.
When a keystone species is removed, the effects do not diminish as they move through the food web. They amplify. This phenomenon — the trophic cascade — explains why the loss of a single species can restructure entire ecosystems.
The clearest documented example is Yellowstone. Wolves were extirpated from the park by the 1920s. Without predation pressure, elk populations expanded and altered their grazing behavior — remaining in river valleys and consuming vegetation down to bare soil. Rivers destabilized. Fish populations declined. Beaver populations, dependent on riverside vegetation, collapsed. Ripple and Beschta (2012) documented the reversal following wolf reintroduction in 1995: elk moved more selectively, riverside vegetation recovered, rivers narrowed and re-stabilized, fish populations returned. A single predator species restructured the entire ecosystem — including its hydrology.
The ocean equivalent operates through sharks. Overfishing of large sharks in the northwest Atlantic allowed cownose ray populations to expand tenfold over three decades, which depleted bivalve beds and collapsed commercial scallop fisheries that had operated for over a century. The apex predator's absence rippled down four trophic levels.
Beyond cascades, ecosystems undergo regime shifts — sudden, nonlinear transitions from one stable state to another. Scheffer et al. (2001) described the mathematical basis: systems near tipping points appear stable until an additional disturbance pushes them past a threshold from which return is difficult or impossible without active intervention. Shallow lakes flip from clear-water to turbid-algae states when nutrient levels exceed a threshold. The algae state is self-stabilizing: algae prevent the light penetration that submerged vegetation requires to return and graze the algae back. Coral reefs follow the same logic.
The biodiversity crisis is not a distant threat — it is a cascade of ecological failures already unfolding in real time, where the loss of species below a critical threshold triggers irreversible collapse. When ecosystems lose species, they do not degrade gradually. They cross tipping points where remaining organisms can no longer perform the functions that keep the whole system alive: pollination, nutrient cycling, pest control, water filtration.
Research on tropical forest fragments reveals the mechanism. Studies show that when forest cover drops below 70%, fragmented patches experience accelerated species loss and ecosystem function collapse — not because the remaining 30% is inherently unstable, but because isolated populations of key species fall below viable breeding populations (Fahrig, 2003). Arthropods are particularly vulnerable, since their rapid reproduction allows us to watch this crisis unfold in real time. A single pesticide application can reduce insect biomass by 75% in agricultural systems, triggering immediate declines in pollinator-dependent crop yields and bird populations that depend on insects for food.
The crisis deepens because biodiversity loss and ecosystem function are not linearly related. A forest losing 10% of its species might retain 90% of its function — until it loses the next 15%, and suddenly carbon storage capacity plummets, water retention fails, and the forest begins converting to grassland. This nonlinear collapse is why ecologists speak of ecosystem resilience as a finite resource being systematically depleted.
What makes this a crisis rather than a conservation challenge is the speed and geography. Biodiversity is collapsing simultaneously across agricultural landscapes, coastal ecosystems, and freshwater systems — the very places that supply food, water, and climate regulation to billions of people. As species continue disappearing at rates 100 to 1,000 times background extinction levels, the question shifts from "Can we prevent extinction?" to "Which ecosystem functions will we lose first?"
Three tipping points in particular have received intense scientific attention because of their scale and irreversibility.
The Amazon Dieback Threshold. The Amazon rainforest generates approximately half of its own rainfall through transpiration — water evaporated from leaves returns as precipitation that sustains the forest. Deforestation interrupts this self-reinforcing cycle. Lovejoy and Nobre (2018) concluded that a deforestation threshold of approximately 20–25% forest loss, combined with climate warming, would push the Amazon past a point from which it cannot recover as closed-canopy forest. At that threshold, the eastern and southeastern Amazon would progressively convert to a savanna-like system, releasing an estimated 50–100 gigatonnes of stored carbon. Current deforestation stands at approximately 17–20%, depending on methodology. The margin is narrow.
Coral Reef Collapse. Hughes et al. (2017) documented three mass bleaching events on the Great Barrier Reef — in 1998, 2002, and 2016 — with the 2016 event killing more coral than any event on record. Bleaching occurs when ocean temperatures exceed the thermal tolerance of coral-zooxanthellae symbioses; corals expel their photosynthetic partners and die if temperatures do not return quickly. IPCC projections indicate 70–90% of reefs will experience severe bleaching annually at 1.5°C warming, and more than 99% at 2°C. Coral reefs support 25% of all marine species despite covering less than 1% of the ocean floor.
Insect Population Collapse. Hallmann et al. (2017) demonstrated that even within protected areas — landscapes designated specifically to prevent human disturbance — total flying insect biomass fell 76% in 27 years. The drivers remain incompletely resolved but likely involve pesticide drift from surrounding agricultural land, landscape-scale habitat simplification, and light pollution. Insect collapse has cascading consequences: reduced pollination, loss of biological pest control, and collapse of the prey base for insectivorous birds, bats, amphibians, and freshwater fish.
Among the world's most carbon-dense and biodiverse habitats, tropical peat swamp forests in Indo-Malaysia have experienced severe degradation through drainage, logging, and conversion to palm oil and pulpwood plantations. Yule (2008) documented the ecological consequences in detail, measuring losses not only in species richness but in the functional processes those species support.
Peat swamp forests store enormous quantities of carbon accumulated over thousands of years. When drained and cleared, they oxidize and release that carbon as CO₂ and methane. Beyond climate implications, the loss of forest cover removes the structural habitat that endemic fish, invertebrates, and plants require — species that evolved specifically to the acidic, low-nutrient conditions of peat swamp environments and cannot relocate when those conditions are destroyed (Yule, 2008).
Yule (2008) also observed that degraded peat swamps do not recover easily. The hydrology is disrupted, fire risk increases dramatically, and colonizing species are typically generalists rather than specialists, resulting in a persistent reduction in functional diversity. This pattern — where ecosystem degradation becomes self-reinforcing — illustrates why preventing initial habitat loss is considerably more effective than attempting restoration after the fact.
Biodiversity is not an environmental amenity. It is infrastructure — biological infrastructure on which human food systems, medicine, water supplies, and pandemic defenses depend.
Food security. Approximately 75% of global food crop types depend on animal pollination — the majority of fruits, vegetables, and nuts are partly or entirely pollinated by wild and managed insects. Natural pest control provided by insectivorous animals is valued at approximately $400 billion per year globally. Soil biodiversity — particularly fungi and bacteria — underpins agricultural productivity independent of chemical inputs; loss of soil organisms reduces water retention, nutrient availability, and crop resilience in ways that synthetic fertilizers partially but not fully compensate for.
Medicine. Approximately 25% of pharmaceutical drugs are derived from or modeled on compounds found in wild species, including aspirin (willow bark), penicillin (fungal mold), taxol (Pacific Yew), and vincristine (Madagascar periwinkle). The WHO estimates that 80% of the global population relies on plant-derived medicines as a primary healthcare resource. Each species lost is a library of chemical compounds from which no future researcher can draw.
Pandemic risk. The majority of emerging infectious diseases are zoonotic — they originate in wildlife and cross to humans when ecological barriers break down. Deforestation and habitat fragmentation bring people into contact with species and pathogen reservoirs that evolved in separate ecological contexts. HIV, Ebola, SARS, COVID-19, and Nipah all followed this pathway. The dilution effect describes how biodiverse ecosystems reduce transmission of many pathogens by distributing them across many non-competent host species; as biodiversity collapses, transmission concentrates in the few remaining generalist species, increasing human exposure.
Economic value. Costanza et al. (2014) estimated global ecosystem services at $125–145 trillion per year — roughly 1.5 times global GDP. Land use change alone destroys an estimated $4.3–20.2 trillion of this value annually. The Taskforce on Nature-related Financial Disclosures estimates that more than $44 trillion of economic activity — over half of global GDP — is moderately or highly dependent on nature. These figures are contested by critics who argue monetization encourages treating nature as a commodity, but they establish the scale of what human economies stand to lose as ecosystem function degrades.
In December 2022, 196 countries signed the Kunming-Montreal Global Biodiversity Framework, committing to protect 30% of Earth's land and 30% of its oceans by 2030. The 30x30 target emerged from conservation science establishing a minimum threshold for halting biodiversity decline.
The scientific basis: Dinerstein et al. (2017) modeled protection scenarios and concluded that protecting 30% of land using an ecoregion-based approach — prioritizing the most biodiverse and intact areas — could halt the extinction of the majority of currently threatened species. Protecting 50% would be required to fully reverse biodiversity loss for all species. Current formal protection stands at approximately 17% of land and 8% of ocean.
The target faces three practical challenges. First, protection quality: an estimated one-third of existing protected areas are under intense human pressure. They are legally designated but receive insufficient management, enforcement, or funding — what conservation scientists call "paper parks." Second, Indigenous land rights: Indigenous peoples manage approximately 22% of Earth's land surface, and these lands contain an estimated 80% of remaining biodiversity. Conservation designations that claim Indigenous territories without consent or benefit-sharing have a poor track record ecologically and a damaging record on human rights. Third, the distinction between protection and restoration: 30x30 can prevent further loss but will not automatically recover ecosystems already degraded below functional thresholds.
The economic framing of biodiversity loss has evolved considerably. Rather than treating species and ecosystems as items on a conservation checklist, economists and ecologists now understand biodiversity as a form of natural capital — an asset that generates flows of services over time. Tisdell (2011) applied interest rate logic to this framework, exploring how the discount rates economists apply to future values affect conservation decisions.
The argument is straightforward but significant: if future ecosystem services are heavily discounted — treated as worth far less than present economic gains — the financial case for conservation weakens artificially. A high discount rate makes it appear rational to liquidate a forest today for immediate revenue, even if that forest would have generated more value in ecosystem services over the following century. Tisdell (2011) found that standard economic discount rates effectively undervalue long-term biodiversity benefits, creating a structural bias against conservation in cost-benefit analyses.
This has practical implications for policy. When governments evaluate infrastructure projects, agricultural expansion, or logging concessions, the discount rates embedded in economic models can systematically undercount what is lost when natural capital is destroyed. Adjusting these rates, or using alternative accounting frameworks that recognize non-market ecosystem values, would change which projects appear economically justified.
The evidence points toward concrete directions. Maintaining structurally diverse agricultural landscapes — such as shade-grown systems — preserves arthropod diversity and the ecosystem functions it supports (Perfecto, 1997). Accounting for extinction debt means that habitat protection today prevents biodiversity losses that will not manifest for decades (Stork, 2009). Preventing peat swamp drainage is more cost-effective than any currently available restoration technique (Yule, 2008). And revising economic discount rates to better reflect long-term natural capital values would shift conservation from a moral argument into a financially legible one (Tisdell, 2011).
The three tipping points — Amazon dieback, coral collapse, insect population decline — underscore that biodiversity loss has thresholds, not just trends. Beyond certain thresholds, the losses become self-reinforcing and the options for recovery narrow dramatically. The appropriate response is not to wait for the scientific consensus to tighten but to act on the current one, which is already sufficient to define the urgency.
Biodiversity loss operates across land use, economic incentives, and governance frameworks simultaneously. Progress requires addressing all three with the same precision the science demands.
The most comprehensive biodiversity assessment ever conducted found that 1 million animal and plant species are now threatened with extinction, many within decades — a rate unprecedented in human history. This figure represents roughly 25% of all assessed species groups.
Source: Science, 2019→The Living Planet Index — tracking monitored populations of mammals, birds, amphibians, reptiles, and fish — recorded an average 69% decline between 1970 and 2018. Freshwater species fared worst, with an 83% average decline. The trend shows no sign of reversal.
Source: World Wide Fund for Nature (WWF), 2022→Modern species are disappearing 100 to 1,000 times faster than the natural background extinction rate documented in the fossil record over millions of years. This acceleration confirms that Earth is experiencing a sixth mass extinction event — the first driven by a single species.
Choose seafood certified as sustainable by the Marine Stewardship Council (MSC) or consult Monterey Bay Aquarium's Seafood Watch guide. This reduces demand for products from destructive fishing or aquaculture practices.
Monterey Bay Aquarium Seafood Watch→The Campaign for Nature's interactive resources explain the goal of protecting 30% of land and ocean by 2030 — including maps of areas already protected and what it would take to reach the target. Understanding the scale helps you talk about it meaningfully with others.
Campaign for Nature: 30x30→Plant native species (which support 29x more insect species than non-natives), remove invasive plants, create brush piles for ground-nesting species, and eliminate pesticides. Urban and suburban yards collectively represent a significant habitat network.
To conserve nature and reduce the most pressing threats to the diversity of life on Earth.
WWF's Living Planet Report is the leading scientific assessment of global biodiversity. WWF has helped protect over 1 billion acres of forests, marine, and freshwater habitat.
To influence, encourage, and assist societies to conserve the integrity and diversity of nature and ensure equitable, ecologically sustainable use of natural resources.
IUCN maintains the Red List of Threatened Species — the world's most comprehensive inventory of the global conservation status of biological species, covering 150,000+ assessed species.
To empower societies to responsibly and sustainably care for nature for the well-being of humanity.
Conservation International has helped protect more than 6 million square kilometers of land and sea across 70+ countries and trained more than 1 million people in sustainable practices.
16 peer-reviewed papers + 3 scientific background sources
Intergovernmental Science-Policy Platform on Biodiversity and Ecosystem Services (IPBES), 2019
The most comprehensive assessment of biodiversity to date, detailing the state of nature, its decline, and the impacts on human well-being.
This article cites 16 peer-reviewed sources from 19 total references. Every factual claim links to its source.
Last reviewed: March 2026. If you find an error or outdated source, contact us at [email protected].
Ivette Perfecto
University of Michigan–Ann Arbor
USA
Arthropod biodiversity loss and the transformation of a tropical agro-ecosystem — Biodiversity & Conservation
Nigel E. Stork
University of Melbourne
Australia
Re-assessing current extinction rates — Biodiversity and Conservation
Express Love Science Team (2026). Biodiversity Crisis. Express Love Planetary Health. Retrieved from https://express.love/articles/biodiversity-crisis
More from Planetary Health
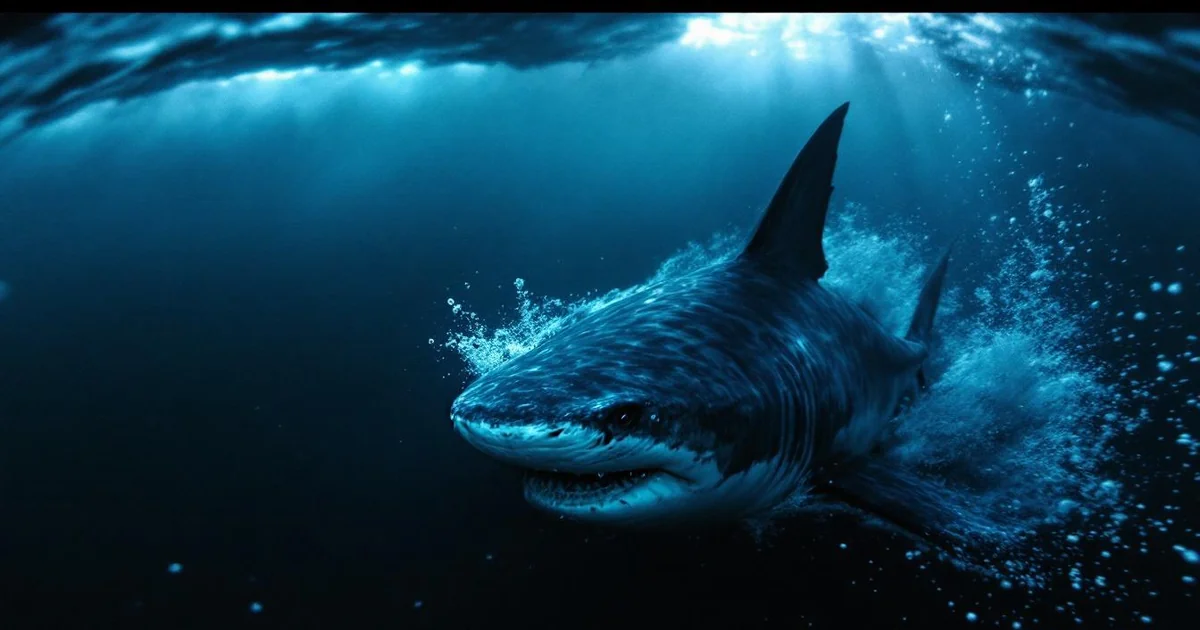
Shark conservation is critical as overfishing and finning threaten apex predators that regulate marine ecosystems. Learn evidence-based protection strategies and their ocean-wide impact.

Ocean acidification disrupts shellfish physiology by lowering seawater pH, which impairs calcification processes in species like oysters and clams, leading to weakened shells and reduced fisheries yields. In juvenile...
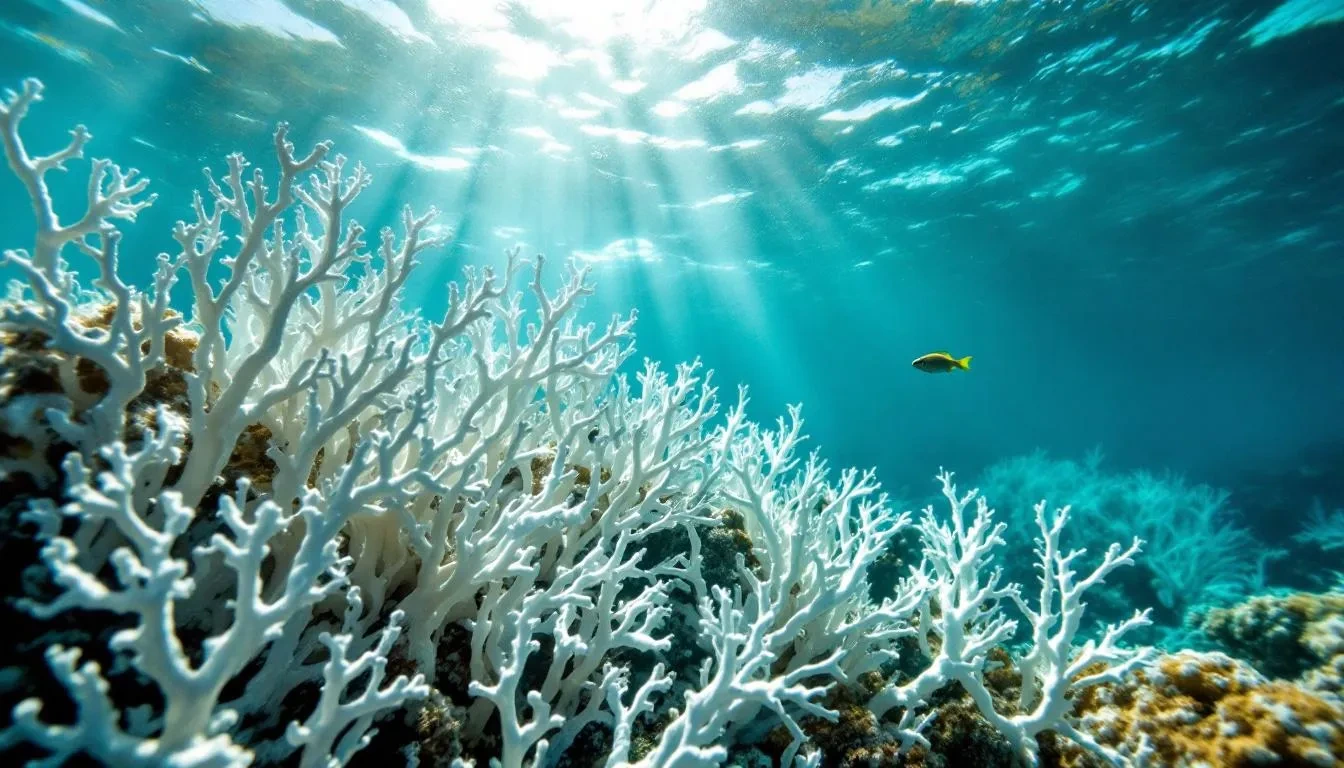
Coral bleaching is a stress response in reef-building corals caused by sea temperatures sustained at 1-2°C above seasonal averages, often exacerbated by El Nino events. This stress leads to the production of excess...
Share this article
Biodiversity Crisis
Biodiversity crisis involves the rapid loss of species and ecosystems due to human activities, triggering cascading biochemical disruptions that undermi...
9 published papers · click to read
12,785
combined citations
Ivette Perfecto
University of Michigan–Ann Arbor
USAArthropod biodiversity loss and the transformation of a tropical agro-ecosystem — Biodiversity & Conservation
186 citations
Nigel E. Stork
University of Melbourne
AustraliaRe-assessing current extinction rates — Biodiversity and Conservation
206 citations
Catherine M. Yule
Monash University Malaysia
Selangor, MalaysiaLoss of biodiversity and ecosystem functioning in Indo-Malayan peat swamp forests — Biodiversity and Conservation
297 citations
Clem Tisdell
University of Queensland
The University of Queensland, Brisbane 4072 AustraliaBiodiversity conservation, loss of natural capital and interest rates — Ecological Economics
11 citations
David Dudgeon
Freshwater biodiversity: importance, threats, status and conservation challenges
8,195 citations
Carl Folke
The Problem of Fit between Ecosystems and Institutions: Ten Years Later
702 citations
Alejandro Estrada
Impending extinction crisis of the world’s primates: Why primates matter
1,451 citations
J. E. N. Veron
The coral reef crisis: The critical importance of<350ppm CO2
428 citations
David L. Wagner
Insect Declines in the Anthropocene
1,309 citations
Researchers identified from peer-reviewed literature indexed in Semantic Scholar · OpenAlex · PubMed. Each card links to the original published paper.
Three-quarters of Earth's ice-free land surface has been significantly modified by human activity — agriculture, urbanization, and resource extraction. More than 85% of global wetland area has been lost since 1700, removing the ecosystems that filter water, store carbon, and buffer floods.
Source: Science, 2019→Even inside designated nature reserves, total flying insect biomass declined 76% over 27 years in Germany. Because insects form the base of most terrestrial food webs — providing pollination, pest control, and prey for birds — their collapse cascades through entire ecosystems.
Source: PLOS ONE, 2017→Across 529 species in all habitats, North America has lost approximately 3 billion birds since 1970 — a 29% reduction in total bird abundance. Grassland birds lost 53% of their populations. The declines cut across common as well as rare species, indicating widespread ecosystem disruption.
Source: Science, 2019→The ocean has absorbed over 90% of excess heat in the climate system, driving warming, acidification, and deoxygenation across marine ecosystems. At 1.5°C of global warming, 70–90% of coral reefs face severe annual bleaching. At 2°C, more than 99% are at risk.
Source: Nature, 2017→Mapping global biodiversity intactness, researchers found that 58% of Earth's land surface — home to 71% of the global population — had already crossed the safe planetary boundary for biodiversity. Below this threshold, ecosystems cannot reliably provide the services human societies depend on.
Source: Science, 2016→Science shows that protecting at least 30% of land using an ecoregion-based approach could halt the extinction of most currently threatened species. In 2022, 196 countries signed the Kunming-Montreal agreement committing to this 30x30 target. Current protection stands at ~17% of land and ~8% of ocean.
Source: BioScience, 2017→Updated valuations of global ecosystem services — pollination, water filtration, carbon storage, climate regulation, disease control — total $125–145 trillion per year, approximately 1.5 times global GDP. Land use change alone destroys an estimated $4.3–20.2 trillion of this value annually.
Source: Global Environmental Change, 2014→Donate to or volunteer with organizations restoring mangrove forests. These coastal ecosystems protect shorelines, sequester 3–5x more carbon than tropical forests, and provide critical habitat for marine life.
The primary drivers of biodiversity loss — land clearing for agriculture, overfishing, and pollution — are directly tied to consumption patterns. Reducing meat consumption (especially beef), buying less fast fashion, and choosing products with biodiversity-certified supply chains each reduce demand for habitat destruction.
To conserve the lands and waters on which all life depends.
The Nature Conservancy has protected 125 million acres of land and thousands of miles of rivers worldwide, and operates in 79 countries.
Science Advances, 2015
A quantitative assessment of the current extinction crisis, comparing modern extinction rates to background rates and establishing that Earth has entered a sixth mass extinction.
World Wide Fund for Nature (WWF), 2022
A biennial report tracking the state of global biodiversity using the Living Planet Index, documenting a 69% average decline in monitored vertebrate populations between 1970 and 2018.
Science, 2014
Analysis of global species diversity and extinction rates using IUCN Red List data, finding modern rates 100–10,000 times above background in well-documented taxa.
BioScience, 2017
Science-based framework for identifying priority conservation areas, establishing that protecting 30% of land using an ecoregion approach could halt the extinction of most currently threatened species.
Intergovernmental Panel on Climate Change (IPCC), 2019
Comprehensive assessment of climate change impacts on ocean and cryosphere systems, including marine biodiversity, coral reefs, and coastal ecosystems.
Reviews in Aquaculture, 2021
Examines how aquaculture, when managed sustainably, can contribute positively to biodiversity and ecosystem services, contrasting with destructive practices like mangrove-clearing shrimp farms.
Proceedings of the National Academy of Sciences, 2017
Ceballos et al. analyzed 177 mammal species and found all lost 30%+ of their geographic range between 1900–2015; 40% lost more than 80%. Introduced the concept of 'biological annihilation' — population-level collapse preceding formal extinction.
Nature, 2011
Barnosky et al. compared modern vertebrate extinction rates to background rates in the fossil record, finding modern rates 100 times above background — establishing the scientific case for a current mass extinction event.
PLOS ONE, 2017
Hallmann et al. measured total flying insect biomass across 63 German nature protection areas over 27 years, documenting a 76% seasonal decline and 82% midsummer decline — even within designated protected areas.
Science, 2019
Díaz et al. (IPBES lead authors) summarized the Global Assessment findings: 1 million species threatened, 75% of land altered, 85% of wetlands lost, current extinction rate 100–1,000x background.
Science, 2016
Newbold et al. mapped global biodiversity intactness and found that 58% of Earth's land surface — home to 71% of the human population — had already exceeded the safe planetary boundary for biodiversity.
Science, 2019
Rosenberg et al. analyzed 529 North American bird species across all habitats and found the continent had lost approximately 3 billion birds since 1970 — a 29% decline in total bird abundance.
Nature, 2001
Scheffer et al. described the mathematical basis for sudden ecosystem transitions — how systems near tipping points can shift rapidly and irreversibly to alternative stable states, with implications for coral reefs, lakes, and forests.
Science Advances, 2018
Lovejoy and Nobre modeled Amazon rainfall feedback dynamics and concluded that a deforestation threshold of 20–25%, combined with climate warming, could push the Amazon past a tipping point from which it cannot recover as closed-canopy forest.
Nature, 2017
Hughes et al. documented three mass bleaching events on the Great Barrier Reef and modeled future projections. At 1.5°C warming, 70–90% of reefs experience severe annual bleaching; at 2°C, more than 99% are at risk.
Annual Review of Entomology, 2021
Wagner et al. synthesized global insect decline evidence, concluding that approximately 40% of insect species are declining globally, with total biomass falling approximately 2.5% per year from multiple interacting stressors.
Global Environmental Change, 2014
Costanza et al. updated their landmark 1997 ecosystem services valuation, estimating total global ecosystem service value at $125–145 trillion per year — approximately 1.5 times global GDP — and documenting losses of $4.3–20.2 trillion per year due to land use change.
Biological Conservation, 2012
Ripple and Beschta documented 15 years of ecological change following wolf reintroduction to Yellowstone: elk behavior altered, riverside vegetation recovered, streams stabilized, beaver and fish populations returned — demonstrating how a single keystone species restructures an entire ecosystem.
Catherine M. Yule
Monash University Malaysia
Selangor, Malaysia
Loss of biodiversity and ecosystem functioning in Indo-Malayan peat swamp forests — Biodiversity and Conservation
Clem Tisdell
University of Queensland
The University of Queensland, Brisbane 4072 Australia
Biodiversity conservation, loss of natural capital and interest rates — Ecological Economics
David Dudgeon
Carl Folke
Alejandro Estrada
J. E. N. Veron